How to Find the Bottleneck in Your Business (Diagnostic)
Find the bottleneck in your business in one afternoon with a 4-step diagnostic, Little's Law worksheet, and decision tree. No software required.
The Verdict: To find the bottleneck in your business, measure three numbers for every step in your core process — work in progress, weekly throughput, and lead time (WIP divided by throughput). The bottleneck is the step with the longest lead time AND a queue that grows week over week. The diagnostic takes one afternoon and needs no software beyond a spreadsheet.
Critical Insights:
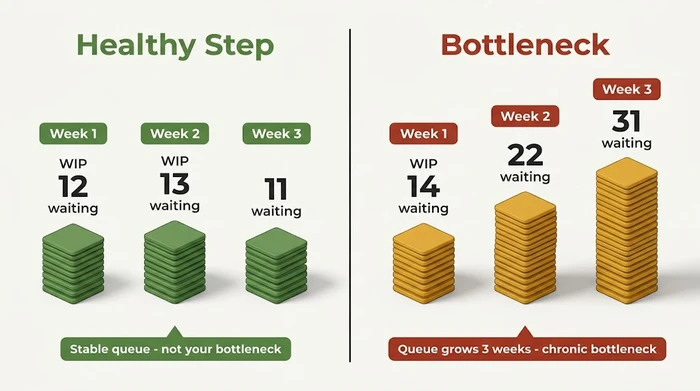
- The bottleneck is almost never the busiest person — it’s the step where the queue in front of it grows for 3 or more consecutive weeks.
- Use Little’s Law (Lead Time = WIP divided by Throughput) to quantify each step; the step with the longest lead time plus a rising queue is your constraint.
- The diagnostic runs on rough data — a 30-minute walk of your process plus 2 to 4 weeks of weekly counts is enough to spot the pattern.
- Don’t hire, buy a tool, or reassign staff until you’ve measured; premature fixes typically move the bottleneck to a worse step and cost £2,000 to £10,000 in wasted spend.
- Apply the 4 principles of the Theory of Constraints in order — Identify, Optimise, Subordinate, Elevate — and expect to rerun the diagnostic every 30 days because fixing one bottleneck surfaces the next.
Something’s stuck in your business — and you can’t tell which thing. To find the bottleneck in your business before you hire into the wrong role or buy the wrong tool, you need one afternoon and a spreadsheet.
This guide hands you the diagnostic — built on the Theory of Constraints and Little’s Law — to pin down the single step throttling your business, with a copy-pasteable worksheet and a decision tree you can run yourself. It’s part of our complete guide to operational efficiency for small business, and it stands on its own as the diagnostic step you run before any fix.
What a Business Bottleneck Actually Is (and What It Isn’t)
A business bottleneck is the step in a process where work arrives faster than it leaves. The queue in front of it grows, the downstream step starves, and total business output can never exceed the output of that one step — no matter how hard the rest of the team pushes.
This is different from a PC hardware bottleneck (CPU throttling a GPU, or vice versa). If you landed here looking for that, this guide isn’t it. Everything below is about business processes: sales pipelines, fulfilment, onboarding, support, approvals.
Three symptoms usually put a founder on the scent:
- Missed deadlines that cluster around the same stage of work.
- A downstream team visibly idle or “waiting on the other team” more than once a week.
- A CRM stage, Trello column, or task list where items pile up faster than they clear.
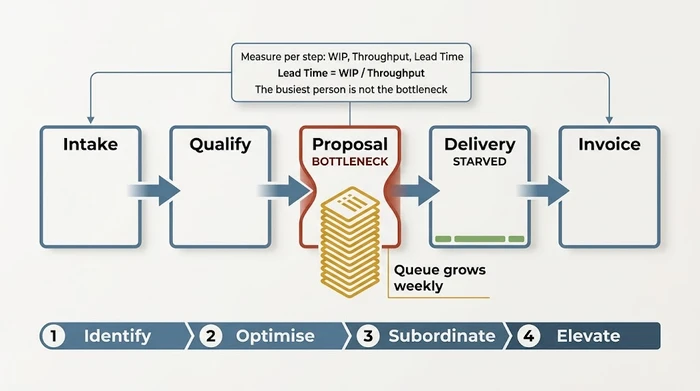
The rest of this article uses four words consistently. Queue = the items waiting in front of a step. Throughput = the items that step completes per week. Work in progress (WIP) = the items currently at or waiting for that step. Lead time = how long a typical item spends waiting. You’ll see them again when we get to Little’s Law.
One counter-intuitive point before you go hunting: the bottleneck is not the busiest person. Almost every founder guesses wrong here on the first pass. The next section explains why.
Why Most Owners Look in the Wrong Place (5 Myths to Drop First)
You’re probably chasing the wrong signal. Most small-business diagnostics fail before they start for that exact reason. Drop these five beliefs before you measure anything.
Myth 1: “The bottleneck is whoever looks most overwhelmed.” Truth: the busiest person is usually downstream of the bottleneck, absorbing the overflow. The real constraint is the step where the queue in front of it is growing week over week. The person clearing that queue may actually look calm — they just have a hard cap on how fast they can work.
Myth 2: “Work is piling up at Step X, so hire another person at Step X.” Truth: hiring before measuring is how founders burn £5,000 to £15,000 on a role that doesn’t fix the problem. Nine times in ten, the “stuck” step is itself the downstream victim, and the new hire sits under-utilised within six weeks. Measure first. Optimise what’s already there. Then hire, if at all.
Myth 3: “Buy a workflow tool and it will sort itself out.” Truth: software is a lever, not a diagnosis. A tool applied to a non-bottleneck step accelerates work into the bottleneck, making the queue worse. Tools amplify whatever process they sit on top of, including a broken one.
Myth 4: “Push harder — the team just needs to work longer hours.” Truth: sustained overtime at a constraint is a capacity mask, not a fix. It hides the problem until the person breaks, at which point the queue doubles overnight.
Myth 5: “Fix every slow step at once.” Truth: the Theory of Constraints is clear here — subordinate every other step to the one constraint you’ve found. Fixing several at once usually fixes none of them and scrambles your ability to measure what worked.
Trust one signal over every gut feeling and every complaint: the step with the growing queue, week over week. That’s it. Everything else is noise until you have that data.
The 4-Step Diagnostic: How to Find Your Bottleneck in One Afternoon
Four steps. One afternoon. One spreadsheet. No tools required.
This is the spine of the article. Follow the steps in order — skipping one breaks the diagnosis.
Step 1 — Map your core process end to end
Pick one process. The one that most directly produces revenue. For most small businesses that’s either the sales pipeline, the fulfilment process, or the client onboarding sequence. Don’t try to map all three at once — you’ll end up with nothing.
List every handoff as a step. A step is anywhere work moves from one person (or system) to another, or anywhere work waits before being picked up. Seven to twelve steps is typical for a 5-to-30-person business. Fewer than five and you’re grouping stages; more than fifteen and you’re measuring tasks, not steps.
Sticky notes, a whiteboard, or a single spreadsheet column will do. It should take 20 to 30 minutes. If you can’t complete your process map in under an hour, that’s itself a finding — your process isn’t documented well enough to run, let alone improve.
Step 2 — Count WIP at each step right now
WIP = items currently waiting at or in front of the step, not yet completed.
Walk your CRM, your Trello board, your Asana project, your spreadsheet, your job bag shelf — whatever actually holds the work — and write the count next to each step. Leads in “qualification”. Proposals in “awaiting sign-off”. Orders in “packing”. Support tickets in “triage”. Pick Tuesday morning and use the same moment every following week.
Another 20 to 30 minutes the first time. Faster every time after.
Step 3 — Measure throughput for the past 2 to 4 weeks
Throughput = items completed at that step per week.
Pull the history from whatever system records completions: CRM stage-movement logs, invoice counts, shipping records, closed tickets. Four weeks of data beats one. Two weeks is the minimum for a signal you can trust. If your systems can’t tell you completions per step per week, start counting today — two weeks of rough forward-looking counts beats four weeks of perfect counts you never gather.
Step 4 — Calculate lead time with Little’s Law and flag growing queues
Here the measurement becomes a diagnosis. Little’s Law states:
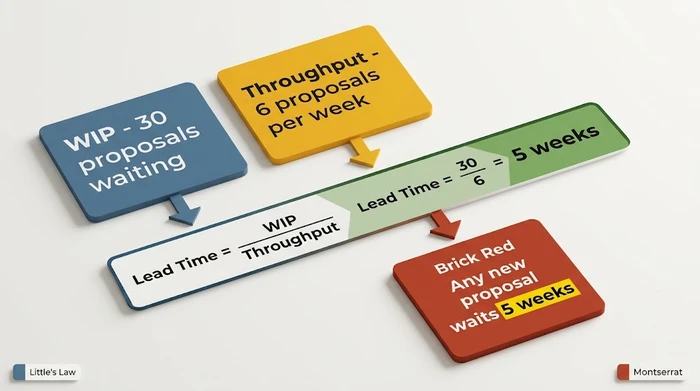
Calculate it for every step. Rank the steps by lead time, longest first. Then overlay the WIP-trend data: which steps had a WIP count that rose each week over your measurement window?
The step with the longest lead time AND a growing queue is your bottleneck. Not the longest alone. Not the growing queue alone. Both.
Worked example — a marketing agency with 7 pipeline stages. Proposal Writing has WIP of 12 and throughput of 2 per week, giving a lead time of 6 weeks. Over the last month its WIP rose from 7 to 9 to 11 to 12. That’s the constraint. The account manager who “feels” overwhelmed sits two steps downstream and is actually starved for approved work at least twice a week. Without the measurement, the agency’s founder would have hired another account manager — and bought six more weeks of the same problem.
The Bottleneck Finder Worksheet
Paste the worksheet below into a spreadsheet, fill in one row per process step, and the bottleneck row becomes visually obvious within minutes. The interactive version flags it for you automatically.
Use the interactive worksheet below to enter your own numbers — lead time is calculated on the fly and the bottleneck is named for you. If scripts are disabled, the static table further down works as a printable fallback.
Static fallback worksheet (for print or no-JS readers)
| Step name | WIP (items waiting at start of week) | Throughput (items completed last week) | Lead Time (WIP / Throughput, in weeks) | Queue trend over last 3 weeks (Growing / Flat / Shrinking) | Bottleneck flag |
|---|---|---|---|---|---|
| Step 1 (e.g. Lead qualification) | ___ | ___ | ___ | ___ | Y / N |
| Step 2 (e.g. Proposal approval) | ___ | ___ | ___ | ___ | Y / N |
| Step 3 (e.g. Fulfilment / delivery) | ___ | ___ | ___ | ___ | Y / N |
| Step 4 (e.g. Client onboarding) | ___ | ___ | ___ | ___ | Y / N |
| Step 5 (e.g. Invoicing / collection) | ___ | ___ | ___ | ___ | Y / N |
How to read it: the step with the longest lead time AND a growing queue is your bottleneck. If two steps tie on lead time, pick the one feeding the more downstream process first.
Worked example — marketing agency, 12 people:
| Step | WIP | Throughput/week | Lead Time | Queue trend | Bottleneck? |
|---|---|---|---|---|---|
| Brief intake | 6 | 8 | 0.75 weeks | Flat | No |
| Creative production | 14 | 7 | 2.00 weeks | Flat | No |
| Client approval | 22 | 4 | 5.50 weeks | Growing | YES |
| Launch / delivery | 2 | 4 | 0.50 weeks | Shrinking (starved) | No — downstream of bottleneck |
The bottleneck is Client approval, not Creative production — even though Creative “feels” the busiest. Launch is starved because approvals aren’t clearing. Classic confirmation pattern.
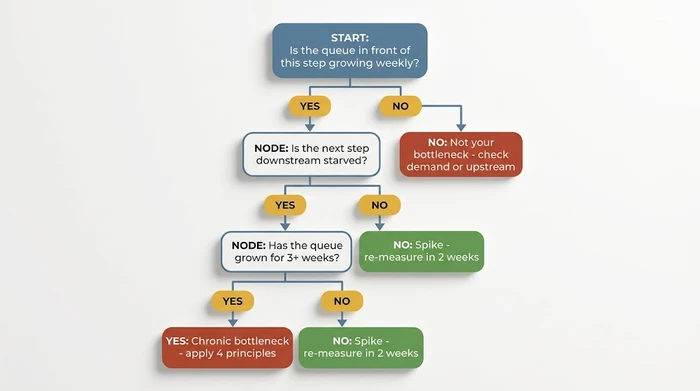
Is This Actually My Bottleneck? A Confirmation Decision Tree
Before you act on the worksheet’s flag, confirm it. Four questions, branching Yes or No. Most false positives get caught at Q1 or Q3.
| Question | If YES | If NO | Reasoning |
|---|---|---|---|
| Q1. Is the queue in front of this step growing week over week? | Go to Q2. | Not your bottleneck. Look upstream (something is throttling intake) or check whether the constraint is demand, not process. | A bottleneck is defined by a queue growing faster than it drains. A flat queue — even a large one — is steady-state, not a bottleneck. |
| Q2. Is the step immediately downstream of it starved (waiting for work, people idle)? | Strong confirmation. Go to Q3. | Weak signal. Either you have multiple bottlenecks, or the downstream step has independent buffers. Recheck the queue measurement across 3 weeks. | A true bottleneck starves downstream steps because it can't hand off work fast enough. If downstream is also busy, you may be measuring in the wrong place. |
| Q3. Has the queue been growing for 3 or more consecutive weeks? | Chronic bottleneck. Apply the 4 principles of bottleneck management, starting with optimising existing capacity before adding more. | Likely a spike (seasonal load, one-off project, staff absence). Re-measure for 2 more weeks before intervening. | TOC distinguishes constraints from transient backlogs. Fixing a spike as if it were a constraint wastes investment and moves the real bottleneck somewhere unexpected. |
| Q4a. Is the bottleneck a person? | Audit what else that person does. Remove non-bottleneck work from their plate before hiring. Often one person holds the constraint because no one else is trained on it. | Go to Q4b. | Person-bottlenecks usually respond to task reassignment and cross-training before they need headcount. Hiring first often moves the bottleneck to onboarding. |
| Q4b. Is the bottleneck a tool or system (software, machine, licence limit)? | Measure utilisation. If under 85% utilised, the problem is scheduling, not capacity. If over 85%, elevate (upgrade, add instance, redesign flow). | Go to Q4c. | Tools get blamed when scheduling is the real issue. Measure before buying. |
| Q4c. Is the bottleneck a decision or approval step? | Reduce approval scope (who really needs to sign off), set decision SLAs, or batch approvals into fixed windows. This is the cheapest bottleneck to fix and the most commonly missed. | Reconsider your process map. You may have grouped two distinct steps into one. Re-draw and re-measure. | Approval bottlenecks (founder review, legal sign-off, client approval) cause more small-business drag than any other category and almost never require new hires or tools. |
Once You’ve Found It: The 4 Principles of Bottleneck Management
Identification is half the job. The fix follows a fixed order — skipping ahead is how most founders waste money. These are the 4 principles of bottleneck management from the Theory of Constraints, in plain English.
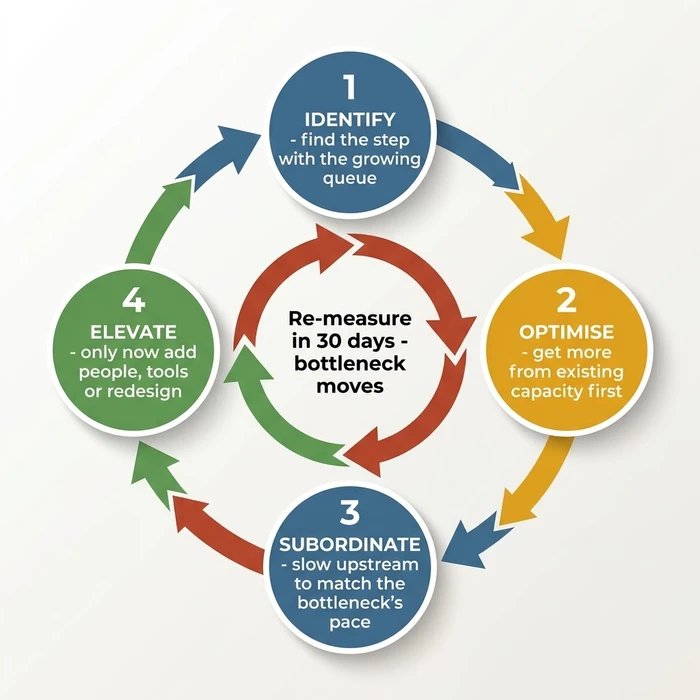
Principle 1 — Identify the constraint. You’ve just done this. The step with the longest lead time and the growing queue. One step, not three.
Principle 2 — Optimise what you already have there before adding anything. Remove interruptions from the bottleneck step. Batch similar work. Strip off any task not directly producing bottleneck throughput. Pull non-bottleneck meetings off the bottleneck person’s calendar. Most businesses recover 20% to 40% of bottleneck capacity here, for free, before spending a penny.
Principle 3 — Subordinate every other step to the bottleneck’s pace. Founders resist this one most, because it feels like deliberately going slower. Stop the upstream steps from pushing more work into the bottleneck than it can clear. A queue of 50 items doesn’t clear any faster than a queue of 15 — it just hides the problem and stresses everyone out. Let upstream people do other work until the bottleneck can accept more.
Principle 4 — Elevate capacity last. Now — and only now — is the spending justified. Hire, buy the tool, redesign the step. By this point you know exactly what capacity you need and you’ve already squeezed every free percentage out of what you had.
The order matters. Owners who jump to Principle 4 and skip 2 and 3 almost always over-hire and under-deliver, because they never found out how much capacity was already sitting idle.
Three Real-World Examples (Different Bottlenecks, Same Method)
Example A — Sales bottleneck at an 8-person B2B agency
Symptoms: the sales pipeline felt “stuck”, and the founder blamed account managers for slow follow-up. Diagnostic showed Proposal Writing had WIP of 14 and throughput of 2.3 per week — lead time of 6 weeks — with a queue growing for five consecutive weeks. Account managers were actually idle two half-days per week waiting for proposals to send.
Fix applied: Principle 2 first. The founder built a template library, protected a 2-hour weekly write block on the proposal writer’s calendar, and reassigned data-entry tasks off that person. Proposal throughput doubled to 4.5 per week within a month. Three weeks of pipeline lead time disappeared before any hiring conversation started.
Example B — Fulfilment bottleneck at a 15-person logistics firm
Symptoms: packing team working until 7pm, picking team leaving at 4pm, client complaints rising. Diagnostic showed Packing had WIP of 86 units and throughput of 120 per day, but WIP was rising 10 units per day. Picking was starving — items were being picked faster than packed, piling up at the packing station.
Fix applied: Principle 3. Picking moved from continuous to batched pulls every 2 hours, matched to packing’s pace. Pickers used the recovered time on warehouse replenishment. Total order lead time fell 40% in three weeks. No headcount change. No new tools. Just subordination.
Example C — Approval bottleneck at a 12-person marketing team
Symptoms: campaigns launching late, creatives frustrated, founder feeling “stretched”. Diagnostic showed every campaign waited at Founder Review — WIP of 9 campaigns, throughput of 2 per week, lead time 4.5 weeks, queue growing. The founder was the constraint.
Fix applied: delegated approval authority for anything under £5,000 to the head of marketing. Set a 48-hour SLA for anything above that. Founder review WIP fell to 2 within a fortnight. Lead time across the campaign process dropped from 7 weeks to 3.5. Zero hires, zero software, under one hour of delegation work.
Three businesses, three different constraint types — a step, a sequencing problem, and a person — diagnosed by the same method and fixed without any “elevate” spend.
Don’t Do This: The Anti-Advice Warning Box
The common mistake: when a small business feels stuck, the first instinct is to look at who’s working the hardest, staying the latest, or complaining the loudest — and assume that person or team is the bottleneck. Founders then pile support, tools, or new hires onto that person, expecting the drag to lift.
Why it’s dangerous: the busiest person is almost always downstream of the real bottleneck, absorbing the overflow from wherever work is actually getting stuck. Helping them process faster does nothing to the constraint; it just lets the downstream step clear slightly faster while the queue upstream keeps growing. Worse, you spend budget, goodwill, and hiring slots on the wrong step.
The expert alternative: walk the process end-to-end and measure the queue in front of every step for three weeks. The bottleneck is the step where the queue grows week after week, not the step where people feel busiest. Use the Bottleneck Finder Worksheet above. Lead Time (Little’s Law: WIP divided by Throughput) plus a growing queue trend is your diagnostic signal — not volume of complaints.
Red flags to watch for:
- You’re about to hire, buy a tool, or reorganise based on who seems overwhelmed, without any queue data.
- The “busy” team is downstream of an approval step, a founder sign-off, or a handoff you haven’t measured.
- Downstream teams are partly idle or waiting — a classic starvation signature of an upstream bottleneck.
- The queue in front of the “busy” step is actually flat or shrinking; the real growing queue is two steps back.
- Someone on the team has said “we’re waiting on X” more than once this month, and X isn’t the team you were about to help.
Variations & Exceptions: When the Method Needs Adjusting
If your business is seasonal: compare the WIP trend against the equivalent weeks last year, not against the previous four weeks, before concluding you have a chronic bottleneck. A queue that always grows between October and December is a capacity-planning signal, not a constraint.
If the constraint is a single person — often the founder: the method still works, but the fix patterns shift. Delegation, decision thresholds (for example, “anything under £5,000 doesn’t need my approval”), and calendar redesign come before hiring. Example C above is the canonical case.
If no work is flowing in at all: you have a demand constraint, not a process bottleneck. The diagnostic will show empty queues across the board and no growing trend anywhere. Redirect your effort to marketing and sales — there’s no internal bottleneck to fix.
If you find two or three bottlenecks simultaneously: rank by lead time, fix the longest first, re-measure after two weeks. Principle 3 — subordinate, don’t split your attention. Trying to fix two constraints at once typically fixes neither and makes it impossible to tell which intervention worked.
If the queue data is messy or missing: start counting today. Two weeks of rough forward-looking counts beats four weeks of perfect retrospective counts you never gather. Little’s Law tolerates rough inputs; it doesn’t tolerate no inputs.
Frequently Asked Questions
Q: How do I know if something is a bottleneck or just a busy week? Measure the queue for three consecutive weeks. A busy week shows a queue that spikes and then settles back. A bottleneck shows a queue growing every week, or at least three weeks in a row, without returning to its starting size. If you can’t yet tell, wait two more weeks and remeasure — don’t intervene on one data point.
Q: What is the difference between a bottleneck and a backlog? A backlog is an accumulated pile of work. A bottleneck is the step that caused the pile to accumulate. You can have a backlog without a bottleneck (for example, after a holiday shutdown) and it’ll clear on its own. A bottleneck won’t clear on its own — the backlog keeps growing until the step is fixed.
Q: Can a person be a bottleneck? Yes. The founder is the bottleneck in roughly one out of three small businesses we see diagnosed, usually at an approval or review step. The method still works — the queue in front of that person grows, downstream goes idle, Little’s Law still holds. The fix is almost always delegation, decision thresholds, or calendar protection — not hiring another senior person.
Q: How often should I re-run this diagnostic? Every 30 days, indefinitely. Fixing one bottleneck almost always moves the constraint to the next-slowest step in the process. That’s success, not failure — the business is moving again. Running the diagnostic monthly keeps you pointed at the current constraint rather than the one you fixed six weeks ago.
Q: What tools do I need? A spreadsheet. Nothing else is required. If your CRM or project tool can export WIP and completion counts per stage per week, that saves 20 minutes of manual counting — but it isn’t essential. Most of our worked examples were diagnosed with Google Sheets and a half-hour walk of the office.
Q: How is this different from a PC or hardware bottleneck? Entirely different domain. A hardware bottleneck describes one computer component (usually the CPU or GPU) limiting the throughput of another. A business bottleneck describes one step in a business process limiting the throughput of the whole process. The words are the same; the frameworks are unrelated. This guide is about the business version.
Conclusion: Find It, Fix It, Find the Next One
One signal decides your bottleneck: the step with the longest lead time and a queue that grows week over week. Not the busiest person. Not the loudest complaint. Not your gut. The data.
Once you’ve found it, the fix order is fixed: Identify, Optimise, Subordinate, Elevate. In that order. Owners who skip Optimise and Subordinate and jump to Elevate routinely over-hire by a full head and still don’t clear the queue.
Expect a new bottleneck within 30 days. That’s not the method failing — it’s the method working. Fixing one constraint moves the pressure to the next-slowest step, which is what you want, as long as you’re ready to re-measure and find it again.
Copy the worksheet, take one afternoon this week, and locate yours. Then revisit our complete guide to operational efficiency for small business for the wider playbook on the fixes that come after identification.
Founder, Too Many Hats
Free tool
What it's costing you
See how many hours your manual tasks are really costing you.
Free tool
Problem Solver
Describe your biggest timewaster and get a personalised plan.
Related Guides
Data Silos in Small Business: Why Your Tools Don't Talk
Stop reconciling reports every Sunday. What data silos look like in a 5-50 person business, the silo tax they cost you, and the 30-90 day fix.
Build Business Systems That Run Without You
Build business systems that run without you: a 6-step framework, decision tree, worked customer-onboarding example, SOP template, and AI prompt.
How to Stop Being the Bottleneck in Your Own Business
Stop being the bottleneck in your business with a 4-layer playbook: diagnose the type, apply Theory of Constraints, transfer ownership, run the vacation test.